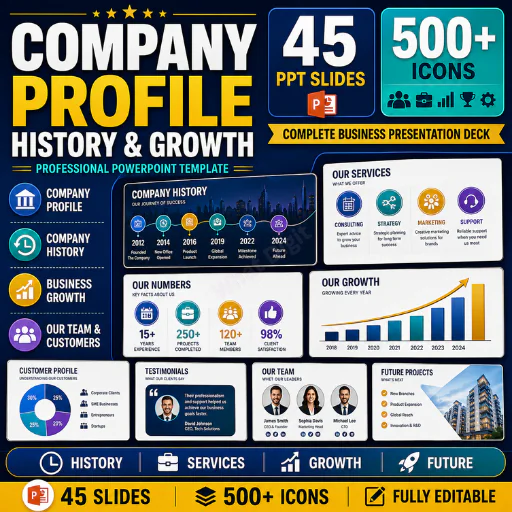
Animated Linear Infographics | Step-by-Step Slides (PowerPoint, Google Slides & Keynote)
This product is built for clear, step-by-step explanation.
The 20 Animated Linear Infographics pack is a process-focused visual system designed to explain flows, stages, timelines, sequences, and progressions in the simplest possible way.
Each infographic follows a linear structure—left to right or top to bottom—so the audience never gets confused about order, priority, or flow.
Animations are smooth and intentional, guiding attention one step at a time.
Light theme for documents.
Dark theme for screens & pitches.
Same clarity in both.
🎯 Best For
Process & workflow explanations
Step-by-step business presentations
Timelines & roadmaps
Strategy & execution breakdowns
Training & onboarding decks
Product, system & lifecycle explanations
🚀 Key Features
20 professionally animated linear infographic slides
Light & Dark themes included
Step-by-step animation flow
Clean, minimal, logic-first design
Fully editable text, shapes & icons
Vector-based elements (no quality loss)
Easy global color change
Master slide–based structure
Presentation-ready layouts
Full HD resolution
🔁 Linear Infographic Types Included
Step progression diagrams
Timeline & phase visuals
Process flow sequences
Roadmap & milestone layouts
Strategy execution steps
Linear comparison visuals
Designed to explain order, not decorate slides.
📦 Files Included
PowerPoint .PPTX
PowerPoint .PPT
Google Slides
Keynote
Documentation file
✔ Cross-platform compatible
✔ Edit once, reuse everywhere
👥 Who Should Use This
Consultants & analysts
Founders & managers
Operations & strategy teams
Trainers & educators
Anyone explaining steps or processes
If your message has an order, this pack keeps it clear.
📌 Important Notes
Preview images are for demonstration only
No stock images included
No plugins or add-ons required
All elements are fully editable
Animations are clean and presentation-safe
📈 Mini Case Study (Practical Use)
A product team used these slides to explain onboarding steps:
Reduced explanation time by 45%
Improved user understanding in demos
Reused the same visuals across sales & training decks
Linear visuals = faster understanding.
Published:
Feb 06, 2026 03:12 PM
Category:
Tags: